Measuring Confidence in Indian Public Institutions
Faculty Contributor : Hema Swaminathan, Assistant Professor
Student Contributors : Rajarshi Mukherjee and Saptarshi Mukherjee
Public trust and confidence are essential for the smooth functioning of the society. In this era of rising political cynicism and dwindling confidence in the government and its officials, it has become a necessity to understand what affects the confidence of the public in the institutions of the government. This paper analyses the effect of various macro-economic, demographic and personal experience factors on the confidence in the public institutions of police, education and health.
Numerous studies conducted in United States, Canada and different European countries have indicated erosion of public confidence in government and governmental processes over the last few decades. Decreasing levels of voter turnout during the elections in UK and US indicates general mistrust in public institutions by many social science researchers.
Causes of variations in Confidence
Various researchers have proposed different explanations for this decrease in public confidence in government and governmental processes observed throughout the world. Harvey Sims1 believes that one of the most important contributors to the loss in confidence is the mismatch between the public expectations and the perceived performance of the government institutions. Unhappiness may stem from a service not rendered, ineffective policy decisions, and improper medical treatment in the government medical institutions or failure of the police in prevention of crime or apprehension of criminals.
Several other studies attribute the variation in confidence in the government and its services to numerous factors like economic globalization and outsourcing (which has led to significant job-losses in the western countries), the internet and the knowledge revolution, the changing role of media etc. Thus, the quality of the government performance or the lack of it is only one of a large number of potentially important and correlated causal factors2.
Methodology and Sample Composition Analysis
University of Maryland and the National Council of Applied Economic Research (NCAER) conducted the India Household Development Survey (IHDS)3 – a nationally representative multi-topic survey representing 41,554 households across 1503 villages and 971 urban neighbourhoods across India. This study uses the results of the IHDS to map the confidence scores recorded for the households to various household and community-level factors.
The confidence questions posed at the household level were of the form –
“Do you have confidence in the <type> Public Institution to provide the requisite service?”
where the answers received were codified as 1 through 4 with 1 representing “great deal of Confidence” and 4 meaning “Hardly any”.
Exhibit 1 shows the sample distribution of the answers recorded for the above questions.
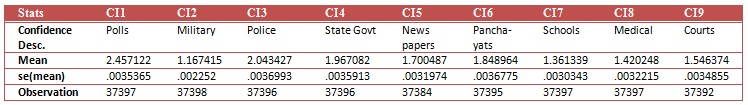 Exhibit 1 Sample Distribution of the Confidence Scores
This study examines the determinants of confidence in the public institutions of police, education and health.
Statistical Model for Confidence
This paper uses an ordered probit model to create the functional form representation of the Confidence metric. Because the dependent variable is ordinal and ordered, ordered probit method is used. The general functional form representation of the confidence model is as follows –
Confidence = f(age, sex, religion, caste, education, literacy, GINI, family composition, no.children, family income, state_gdp, <specific interaction factors>)
Confidence in Police
Various papers analysing the factors behind the confidence in police indicate demographic factors like age, sex, race and socioeconomic status4. Older people are much more conservative and supportive of the police role than the younger ones. One of the important factors that has a great impact on the confidence metric, is the inter-personal factor, including points of contact. Interactions can be of two types – involuntary and voluntary. Some studies5 showed that the type of interaction as well as the outcome affects the confidence level in the police.
We consider three research hypotheses for the police –
RH1: Confidence in Police is higher among higher caste.
RH2: Confidence in Police is higher among high-income groups.
RH3: Exposure to media negatively affecting Confidence.
Exhibit 2 shows the marginal effects from the ordered probit specification. The marginals show the change in probability for obtaining a particular categorical outcome for a unit change in the independent variable.
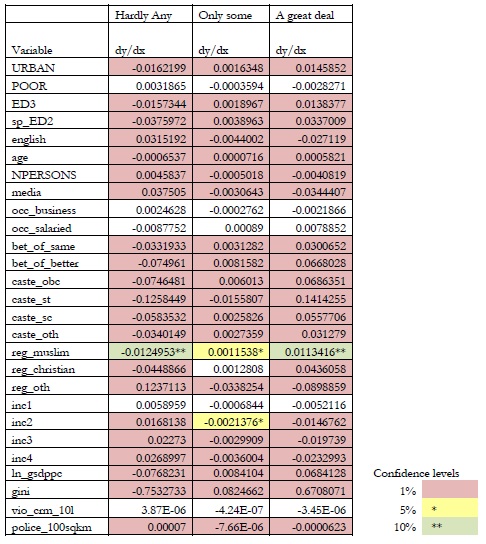 Exhibit 2 Marginal Effects Analysis for the Confidence in Police Model
Here are the interpretations of the marginal coefficients in the above model:
- For an urban person the probability of having a great deal of confidence in police is 0.015 higher than that of a rural person as is for a person who has attended school against one who has not.
- A person with a literate spouse has a 0.034 probability of having a greater confidence in police.
- As compared to a Brahmin, a person belonging to SC/ST/OBC has a “great deal of confidence” in police with higher probability while they have “only a little” confidence with lower probability which leads us to infer that a lower caste individual has a higher confidence in police contrary to our hypotheses. A possible explanation may be that police is probably the only hope against caste based atrocities. We also find that the minorities like Muslims and Christians have higher confidence level on the police.
- The income variables were significant. The negative marginal coefficients indicate lower confidence level in the police among higher income groups e.g. the affluent section has a 0.023 less probability of having a great deal of confidence on the police compared to the poorest.
- The “better off” variables suggest a person who feels that his condition has remained same over the last 10 years has 0.033 higher probability of having a great deal confidence in police compared to those who feel they are worse. Similarly, those who feel they are better show a 0.066 higher probability of having a great deal of confidence compared to those who feel they are worse off.
- Finally, we see that if a household has media exposure, the probability of having a great deal of confidence is 0.034 lower compared to those who do not. This may be because the media is a strong critic of the vices of the police. Media talks more about crimes or failures of the police than about its achievements, which could presumably affect confidence levels. This leads to the lower confidence level.
Confidence in Education
In the study by Sonalde Desai, Cecily Darden Adams and Amaresh Dubey6 done for the IHDS, the authors have drawn attention towards the racial divide still at large in the Indian society which has an important bearing on educational achievement. They have also noted that while there remain several hypotheses about the social factors, which affect the disparities in Indian public education, the precise mechanisms through which the inequalities in the educational attainment manifests itself is still open to debate. However, the predominant explanations relate to child-labour, poverty, lack of access to schools, teacher discriminations and lack of interest in education.
We consider three research hypotheses for education –
RH1: Higher the media exposure, greater would be the confidence in schools.
RH2: Higher the Gini coefficient (that is greater inequality within a society), greater confidence is reposed in educational institutions as they can help level the playing field.
RH3: Upper castes have higher confidence in schools.
The marginal effect analysis is as given in Exhibit 3.
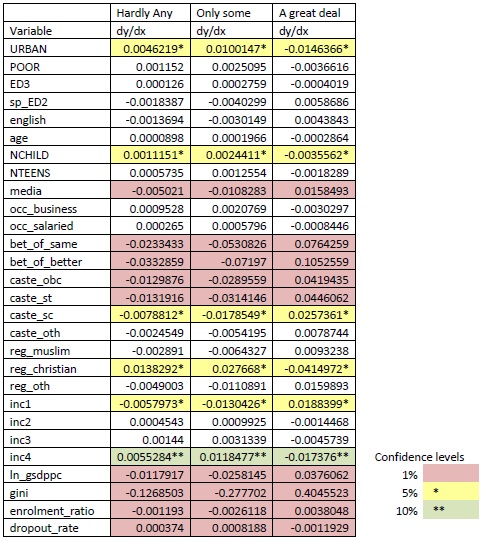 Exhibit 3 Marginal Effects Analysis for the Confidence in Education Model
Here are the explanations of the marginal coefficients for the significant independent variables:
- The rural population is more likely to show a great deal of confidence in education. Unlike their urban counterparts, they have fewer choices and hence, more likely to accept what they receive whereas the urban masses have a wider set to choose from.
- We find that for each additional child in a household, probability of having a great deal of confidence falls by 0.0035 while the probability of having hardly any confidence increases by 0.001.
- From the caste variable we see that the probability of an OBC/SC/ ST having a great deal of confidence is higher compared to Brahmins.
- Higher media exposure leads to greater confidence in schools (unlike police) and a person having access to media will be 0.016 more probable to have a great deal of confidence and 0.006 less probable to have only some confidence.
- We find the macro (state) variable is very significant. An incremental change in the Gini coefficient will lead to a 0.404 probability increase in a great deal of confidence. This is quite counter intuitive. However, we feel it may be because, greater inequality is leading to higher confidence on educational institutions in order to attain equality.
- Along the expected lines, we see that higher the enrolment ratio of a state and lower its dropout rate more probable is an individual to have a great deal of confidence on schools.
Confidence in Health
The research hypotheses that we set are:
RH1: Poor people will have lesser confidence in medical institutions.
RH2: Educated people will have more confidence in doctors.
RH3: A personal morbidity experience (short term or long term) will affect confidence in a negative way.
The marginal effect analysis is as given in Exhibit 4.
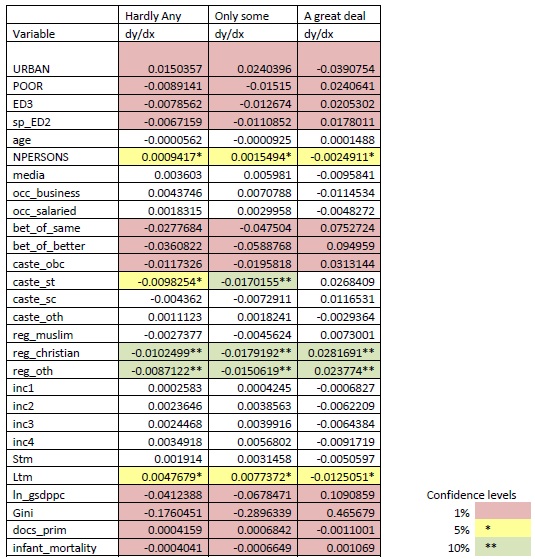 Exhibit 4 Marginal Effects Analysis for the Confidence in Health Model
The marginal coefficient analysis gives us interesting outcomes:
- We find that an urban household head is 0.039 less probable to have a great deal of confidence compared to a rural household head.
- The head of a household below the poverty line is 0.024 more probable to have a great deal of confidence compared to one who is not. This is probably because the health amenities available to the poorer sections are limited and hence, they are likely to be heavily dependent on them.
- Observing the marginal coefficient for variable ED3, we find that a person who has attended school is 0.021 more probable to have a great deal of confidence on doctors.
- In addition, if the spouse is literate there is a 0.017 higher probability to have a great deal of confidence in medical institutions.
- The “better of” variables suggest a person who feels that his condition has remained same over the last 10 years has 0.075 higher probability of having a great deal confidence in health institutions compared to those who feel they are worse. Similarly, those who feel they are better show a 0.095 higher probability of having a great deal of confidence compared to those who feel they are worse off.
- When we look at household morbidity experience, we find that although short-term morbidity is not significant, long-term morbidity is. In addition, both these show a negative marginal coefficient in “a great deal” category implying morbidity makes a person less probable to have a great deal confidence on doctors.
- Like the education model, we find higher the GINI (higher inequality) of a state more probable is a person to have a great deal of confidence, and less probable to have hardly any confidence. This is quite contrary to expectations.
Conclusion
The purpose of the study was to find out what factors influence confidence in public institutions. It is not just the performance of the institutions that influence perceptions but also the socio-economic environment of the individual and his/her personal experience with those institutions. As a part of this project, we came across several interesting observations.
Firstly, talking about performance shaping perceptions, we observed variations across the three institutions we studied - health, schools and police. High enrolment ratio and low dropout rate in a state negatively affected confidence levels in schools. However, when we looked at confidence in health institutions we found results to the contrary i.e., better the health parameters in the state lower the confidence. Hence, we cannot say anything definitive about the link between institution performance and public perception, as a lot depends on information dissemination and awareness regarding the particular institution.
Socio-economic factors play a large role. We observed that media exposure, location (urban or rural), poverty, literacy and caste of the individual have varying effects on confidence on different institutions. At a very general level we found that the backward section of the population, be it in terms of income, caste or location has higher confidence on public institutions. In addition, it was interesting to note that media exposure had different effects on confidence levels on different institutions. So, on one hand while media increased confidence in schools, it reduced confidence in police.
Talking about our research on how personal experiences affect perception on institutions (we did this for health and police), we found that personal experience significantly affect confidence levels. We considered only negative experiences and not surprisingly, found that it dents the confidence level considerably.
Keywords
Economics, Public Policy, Confidence, Public Institutions
Contributors
Hema Swaminathan is an Assistant Professor at the Centre for Public Policy at IIM Bangalore. She completed her PhD in Agricultural Economics from Pennsylvania State University, USA. She can be reached at hema.swaminathan@iimb.ernet.in
Rajarshi Mukherjee (PGP 2008-10) holds a B.E. Degree in Electronics and Telecommunications Engineering degree from Jadavpur University, Kolkata. He can be reached at rajarshi.mukherjee08@iimb.ernet.in
Saptarshi Mukherjee (PGP 2008-10) holds a B.E. Degree in Electronics and Telecommunications Engineering degree from Jadavpur University, Kolkata. He can be reached at saptarshi.mukherjee08@iimb.ernet.in
References
1 Sims, H., 2001, “Public Confidence in Government, and Government Service Delivery”, Canadian Centre for Management Development.
2 Hurst, Y., Browning, S. L., & Frank, J., 2000, “The Attitudes of Juveniles toward the police - a comparison of black and white youth”, Policing: An International Journal of Police Strategies & Management, Vol. 23, No. 1, pp 37-53.
3 India Human Development Survey (IHDS), http://ihds.umd.edu
4 Ivkovic, S. K., 2008, “A Comparative Study of Public Support for the Police”, International Criminal Justice Review , Vol. 18, No. 4, pp 406-434.
5 Reisig, M. D., & Giacomazzi, A. L., 1997, “Public evaluations of police performance: An analysis across three levels of policing”, Policing: An International Journal of Police Strategies & Management, Vol. 20, No. 2, pp 311-325.
6 Desai, S., Cecily, A., and Dubey, A., 2007, “Segmented Schooling: Inequalities in Primary Education.”, Working Paper 06, Presented at the Social Exclusion and Inclusive Policy Workshop, Indian Institute of Dalit Studies, New Delhi, October 26-27, 2007.
