Herding Behaviour of Mutual Fund Managers: Empirical Analysis on the Indian Market
Faculty Contributor : Vijaya B. Marisetty, Associate Professor
Student Contributors : Manikandan N. P. and Senthil Kumar V.
This paper analyses the influence of herding behaviour on Indian mutual fund managers. Empirical analyses on the data indicate significant herding by the Indian fund managers. The study further analyses and interprets herding measurement across time, herding measure of subgroups of stocks, herding measure by different schemes and buy and sell herding. The paper discusses the various reasons for managers to herd and does a comparative analysis of the herding behaviour in the US, German and Portuguese mutual funds market.
A mutual fund is an indirect investment product that allows the investor to invest in various instruments including bonds, stocks, short term money market instruments, commodities and other mutual funds. Earnings on mutual funds can be of two types: capital appreciation of units and dividends. In India mutual funds started when the Unit Trust of India (UTI) was set up in 1963. After the financial reforms and liberalisation in 1993, private players entered the mutual fund industry. Some of the established mutual funds in India are those of Reliance, HDFC, HSBC, ICICI Prudential, LIC, JP Morgan, Kotak Mahindra, Lotus India and State Bank of India 1 .
The expectation from mutual fund managers is that they should act independently, that is buying and selling of the stock of one of the firms by a particular fund manager should not affect the other mutual fund managersÆ decision to invest. However, in practice, often this is not the case and mutual fund managers are influenced by each otherÆs investment decisions in a display of herding behaviour. Here we proceed to analyse the herding measure exhibited by the mutual funds in India in a systematic manner.
Reasons for Herding
The main reason for herding behaviour is that the fund managers tend to believe that the person who extensively trades with a particular stock has more private information about the company. This belief increases the flocking behaviour among the other fund managers and induces them to follow the person who is perceived to possess more private information and trade the particular stock in the same direction 2 . The second reason for herding is that they have correlated private information. With the prior trading knowledge with certain stocks, a group of managers may buy or sell those stocks together based on the gathered private information about the company. For example, if a number of mutual fund managers possess some inside information about a technological breakthrough in a particular company, then they would buy the stocks of that company. But as this information is not available to the public, it would appear like these managers were involved in herding to buy this particular stock.
Aversion to certain stocks also leads to herding effect. Managers do not prefer certain kind of stocks. For example, if a stock becomes illiquid, then there will be an aversion towards that stock and it would lead to herding in selling of that stock. Another reason for herding is to avoid reputational risk. Hence, managers tend to follow other leading fund managers and are not willing to take risk at the cost of their own reputation by doing something different from the others.
Herding Measurement
Herding is the tendency of a given subgroup of funds to trade a given stock together in the same direction. Herding measure gives the excess of the proportion of funds that trade in a stock in the same direction minus the expected proportion of funds trading in that direction if there was no herding. We used the herding measure given by Lakonishok, Shleifer and Vishny in 1992 3 . Herding is the excess proportion of money managers buying or selling a particular stock in a particular quarter as defined below.
HM(i,t) = [ P(i,t) ¢ Exp(P(i,t)) ] ¢ Exp[ P(i,t) ¢ Exp(P(i,t)) ]
P(i,t) = Number of buyers of a stock i in quarter t / (Number of buyers of a stock i in quarter t + Number of sellers of a stock i in quarter t).
The first term gives the propensity of the stock i to be more intensively bought or sold by institutional investors in a quarter when compared to all stocks in that quarter. The second term is the correction term. It accounts for the natural dispersion of stock transactions by the institutional investors.
We define two terminologies, namely buy herding and sell herding. Buy herding is the average of individual herding measurements for which the proportion of buying is greater than the average proportion of buying. Whereas sell herding is the average of those herding measurements for which the proportion of selling is higher than the average proportion of selling.
Results
We collected the information about the portfolio holding of various mutual funds in India from July 2005 to January 2010. The data is collected from Ace Mutual Fund 4 . From the empirical analysis of the data set, we obtain the following results.
Empirical Analysis
We calculated the herding measure for each quarter and the average herding measure was around 17.31%. It means that out of 100 mutual funds that are trading a particular stock, about 17 funds have probably not taken independent decisions and they have traded together in the same direction as other traders. There was no significant difference in the herding level across quarters. Exhibit 1 shows the herding measure for each quarter across five years.
 Exhibit 1 Herding measure in percentage terms for the four quarters across years
Herding Measure for Subgroups of Stocks
We grouped the stocks according to the number of transactions it had undergone. We plotted this in a graph as shown in exhibit 2. The graph shows that the shares that have undergone large number of transactions tend to exhibit higher herding. When there is more buying of a share then there is more chance that more mutual funds buy the stock due to herding and not through independent decisions.
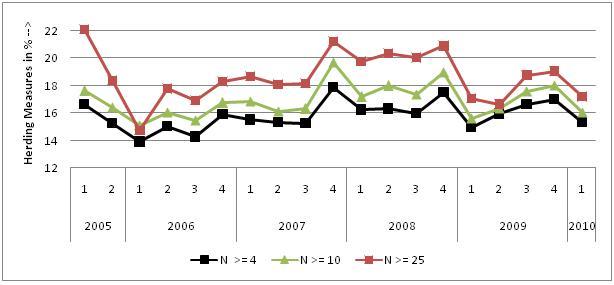 Exhibit 2 Herding measure by subgroup of stocks
Buy and Sell Herding
We observe that the average buy herding is 18.61% and the average sell herding is 16.30%. This shows that the Indian managers tend to display more buy herding than sell herding. This is illustrated through exhibit 3.
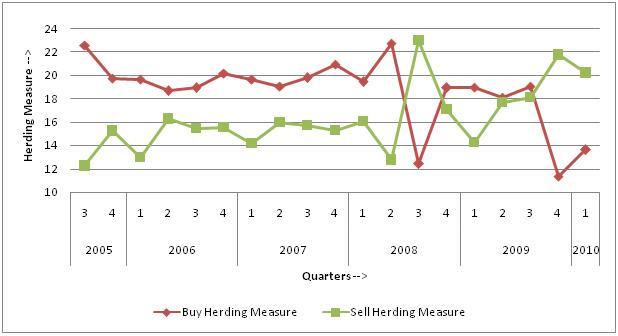 Exhibit 3 Buy & Sell herding measure
Herding by Different Schemes
Each mutual fund offers a variety of schemes. We calculated the herding measure of various schemes across quarters. From exhibit 4, we can see a wide variety of herding measures across different schemes. Some schemes exhibit lesser herding measurement in the order of 2% to 4%. While some other schemes exhibit very high herding measures in the order of 25-30%.(Names of schemes have not been revealed here.)
 Exhibit 4 Herding by different schemes
Herding Measure for Growth and Income Funds
We divided the stocks into two categories namely growth stocks and income stocks. From the herding measurement of individual stocks, we calculated the average herding level of these subgroups. The average herding across all the quarters for the income stock is 17.10% and the average level of herding for all quarters for the growth stock is 18.28%. The average herding measurement of the growth funds is greater than the income funds by about one percentage point.
Mutual Fund Herding in Other Countries
Wermers (1999) 5 showed that the herding measure for mutual funds in USA from the year 1975 to 1994 was about 3.04%, which is very less compared to the 17% as we saw for the Indian mutual fund markets. There is greater degree of herding among the growth stocks than that among the income stocks. Also there is a greater degree of herding among the smaller income stocks than the larger stocks.
Lobao & Paula (2001) 6 investigated herding behaviour in Portugal during the period 1998 to 2000. The average level of herding was more than that in the US and UK markets and it was about 11%. As the Portuguese market is more volatile than the US or UK markets, we can conclude that there is more herding in volatile markets. There was lower amount of herding during the time when market was stable and the herding level was high during periods of volatile markets.
Oehler & Stefan (2006) 7 confirmed the presence of herding in the German mutual funds market. There was no clear evidence for the herding across time. The paper also concluded that herding was smaller for firms which focus on Europe and funds with global investments. The herding was larger for mutual funds who invested in German companies. The average herding in Germany is less and is in the range of 3% to 4%.
Conclusion
As we can see from our results, there is a significant level of herding among fund managers in India. On an average, out of 100, 17 times the decisions taken on buying or selling are not independent decisions. There is no evidence for one particular quarter having a lesser herding measure than the other quarters and also not much evidence for change in the herding measure across the four quarters. The analysis also shows that the shares that undergo a large number of transactions tend to exhibit higher herding.
In India, the buy herding measure is greater than the sell herding measure. The growth funds exhibit higher level of herding than the income funds and the percentage point difference is very about 1 percentage point. Even the different schemes within the same mutual fund houses exhibit different levels of herding. Considering the example of ICICI, we found that the schemes such as ōICICI Prudential Monthly Interval IIö exhibit very less herding and schemes such as ōICICI Prudential Advisor-Aggressiveö, ōICICI Prudential Advisor-Cautiousö exhibit higher levels. Developed countries and less volatile markets exhibit lesser herding than developing countries and more volatile markets.
Keywords
Financial Services, Finance and Control, Herding Behaviour, Indian Mutual Funds, Stock prices, Mutual Fund managers, Fund managers, Flocking
Contributors
Vijaya B. Marisetty was an Associate Professor in the area of Finance and Control at Indian Institute of Management, Bangalore. He currently teaches at RMIT University, Australia. He can be reached at vijayabhaskar.marisetty@rmit.edu.au
Manikandan N. P. (PGP 2009-11) holds a B.E in Computer Science and Engineering from PSG College of Technology, Coimbatore. He can be reached at
manikandan.p09@iimb.ernet.in
Senthil Kumar V. (PGP 2009-11) holds a B.E in Electronics and Communication Engineering from College of Engineering, Guindy, Anna University. He can be reached at
senthil.kumar09@iimb.ernet.in
Keywords
Banking, Rural Banking, Microfinance, Rural Credit, Delphi Study
References
-
ōHerding and Bondingö,
http://www.moneylife.in/article/3652.html, last accessed on December 10, 2010
-
Stefan Frey, University of Taubingen, Patrick Herbst, Goethe University Frankfurt, Andreas Walter, University of Taubingen, ōMeasuring Mutual Fund Herding ¢ A structural Approachö,
http://papers.ssrn.com/sol3/papers.cfm?abstract_id=984828, last accessed on December 12, 2010
-
Lakonishok, Shleifer and Vishny, ōThe impact of institutional trading on stock pricesö, Journal of Financial Economics, Vol. 32, 1992
-
ACE Mutual fund
http://www.accordfintech.com/product_mf.html, last accessed on December 12, 2010
-
Russ Wermers, ōMutual Fund Herding and the Impact on Stock Pricesö, The Journal of Finance, Vol. Liv, No. 2, April 1999
-
Julio Lobao and Ana Paula Serra, ōHerding Behaviour- Evidence from Portuguese Mutual Fundsö, 2001,
http://www.fep.up.pt/investigacao/cempre/actividades/sem_fin/sem_fin_01/PAPERS_PDF/paper_sem_fin_20jun02.pdf , last accessed on December 12, 2010
-
Andreas Oehler, Stefan Wendt, Bamberg University, ōHerding Behavior of Mutual Fund Managers in Germanyö,
http://www.fma.org/Prague/Papers/Herding_Behavior_of_Mutual_Fund_Managers_in_Germany.pdf, last accessed on December 12, 2010
