Protectionist Trends in Global Trade: A Case of Murky Protectionism
Faculty Contributor : Rupa Chanda, Professor
Student Contributors : Emmanuel Joseph and Mohamed Afsal Majeed
The recent economic slowdown has affected international trade in multiple ways. Many countries have introduced measures to protect their domestic industries and local jobs in the wake of this economic crisis. This article analyses and compares the nature of protectionist instruments in the pre and post crisis periods. It finds that there has been a growing trend towards murkier protectionist instruments, including measures in the form of subsidies, local content requirements, stimulus packages tied to procurement practices, and standards. It examines the cases of the steel and automotive sectors to illustrate the changing nature of these protectionist instruments.
Global trade enables the efficient utilization of resources and the exploitation of economies of scale. Since the Second World War and until 1994, the General Agreement on Tariffs and Trade (GATT) acted as the main policy framework governing international trade. In 1995, The World Trade Organization (WTO) replaced the GATT.
It is well recognized that global trade is closely tied to economic business cycles, falling considerably during economic slowdowns and rising during upturns. The recent economic slowdown resulted in a huge decline in trade across different countries and regions, reflecting the high degree of integration and synchronization of business cycles across economies today. In response to political economy pressures and domestic compulsions resulting from rising unemployment and collapsing industries, many countries introduced a variety of protectionist measures to safeguard their interests, further contributing to the decline in trade. Given the interdependence of economies, it is important to analyze the nature of these trade restrictions and to compare them with restrictions used in the pre-crisis years. It is also important to examine specific sectors where protection has been prevalent for many years in order to understand how these measures have evolved in the post-crisis period and to gauge their likely impact.
Protectionism – Post Financial Crisis
Trade barriers1 usually tend to rise during periods of economic slowdown, declines in international prices of primary products, and declines in credit availability. Trade barriers typically take the form of Tariff and Non-Tariff Barriers (NTBs). Tariffs are direct simple duties on goods to extract and transfer some part of the consumer surplus to producers. Non-tariffs are not direct measures. They often take the form of quantitative restrictions, local content requirements, Antidumping Duties (AD), Countervailing measures (CV), Technical Barriers to Trade (TBT), and various other standards.
The recent financial meltdown2 has been no exception. As in the case of earlier downturns, there has been a rise in protectionism around the world following the 2008 financial crisis, particularly in some of the so-called sunset industries such as automotive and steel.
Increasing Incidence of Murky Protectionism
With the decline in tariffs resulting from successive rounds of trade liberalization under the GATT, countries have been increasingly relying on non-tariff instruments to protect their industries. Such a trend has been termed by some as murky protectionism – practices that restrict trade, but are difficult to identify and quantify and may not directly be seen as protectionism.
The free trade versus protectionism dilemma was apparent at the Pittsburgh Summit of the Group of Twenty (G-20) nations soon after the unfolding of the financial crisis. Although the G-20 nations pledged to unite in their attempts to prevent trade barriers, soon after returning to their respective capitals, several of them introduced new protectionist measures.
Between October 2008 and October 2009, the G-20 nations proposed 78 trade measures of which 66 involved trade restrictions and 47 of these measures were eventually approved. As shown in Exhibit 1, all 47 measures implemented by the G-20 nations were non-tariff restrictions, with two-thirds of these being classified as murky protectionist measures.
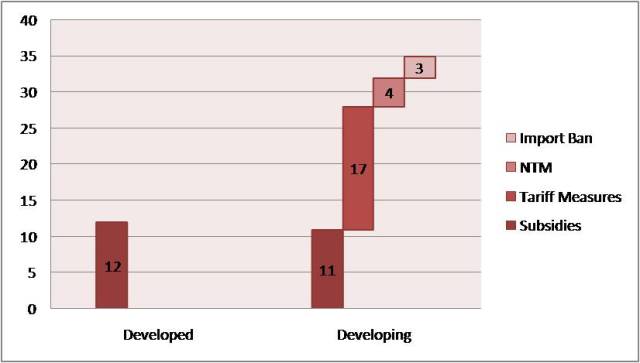 Exhibit 1 Types of Measure - Oct 2008 to Oct 2009 (Source: WTO Trade Note)
Comparison of Crisis vs Non-Crisis Trade Barriers
Since data on trade measures are not available for a sufficiently long time period on a consistent basis, the analysis was carried out by considering two specific time periods, one a high growth period and another a recessionary period, as given below3.
Period 1: March 2003 to October 2004: This time-frame is representative of a growth era.
Period 2: October 2008 to October 2009: This period captures the post-recessionary period.
The two time periods are compared based on following parameters.
Number of Barriers
Despite the fact that the number of months under consideration for the growth period exceeded that for the recessionary period, it was found that the number of measures initiated in the latter case increased by about 130% as indicated in Exhibit 2. This clearly indicates the increased propensity across governments to impose protectionist measures following the recent crisis.
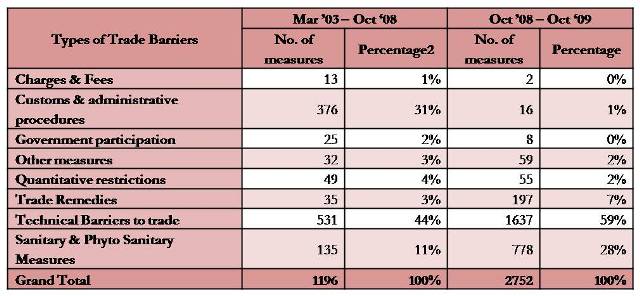 Exhibit 2 No. Of Trade Barriers - Crisis Vs Non-Crisis Period (Source: OECD, CCS Analysis of TBT Notification Documents, SPS Notification Documents and TPR Notifications Documents, WTO)
Types of Barriers
The analysis indicated that not only did the number of protectionist measures increase following the crisis, but that there was also a clear trend towards NTBs. Analysis further revealed that certain kinds of NTBs were preferred over others. In particular, while the occurrences of customs and administrative procedures declined, the share of instruments such as technical barriers to trade, sanitary measures, and trade remedies (Anti-dumping and Countervailing subsidies) increased as indicated in Exhibit 3.
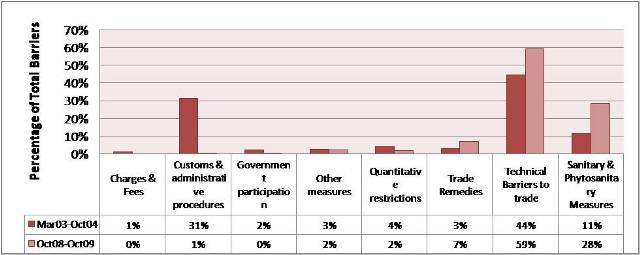 Exhibit 3 Types of Non-tariff Barriers - Crisis Vs Non-Crisis Period (Source: OECD, CCS Analysis of TBT Notification Documents, SPS Notification Documents & TPR Notifications Documents, and WTO)
Affected Sectors
The analysis indicated that the level of restrictions varied from sector to sector. This was dependant on a number of factors like size of the industry, number of people employed, contribution to GDP, and influence in policy making. Machinery and Electrical Equipment was among the most protected sectors. While the level of protection for animal products and textiles declined (the latter due mainly to the removal of the MFA) protection of machinery and vegetable products increased tremendously as shown in Exhibit 4.
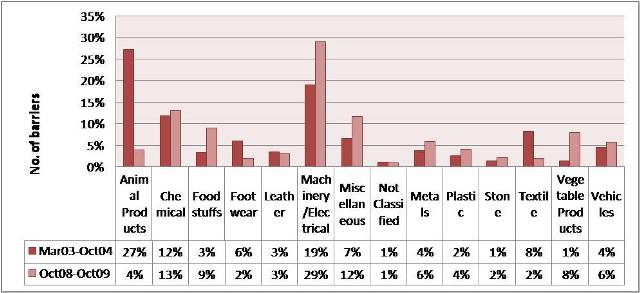 Exhibit 4 Sector-wise Non-tariff Barriers - Crisis Vs Non-Crisis Period (Source: OECD, CCS Analysis of TBT Notification Documents, SPS Notification Documents & TPR Notifications Documents, and WTO)
Since about 87% of the total Non-Tariff measures were found to take the form of Technical Barriers to Trade (TBT) and Sanitary & Phyto-sanitary (SPS) standards, a sector-wise break-up of these measures without including TBT and SPS was undertaken to understand the relative significance of each sector. Steel and Chemicals emerged as the most protected sectors.
Sectoral Analysis – Steel and Auto
Steel has traditionally been among the most protected sectors, especially because of the political and regional clout it commands in many countries and intense lobbying that often takes place by steel companies. Furthermore, in the context of the recent crisis and protectionism, the automotive sector is particularly relevant. The sector has seen a large number of bailouts and conditionalities attached to trade and sourcing, which have potentially trade restricting effects and have raised concerns in the aftermath of the crisis.
Steel Sector
The US, Japan and the Former Soviet Union were the prominent steel producers in the past. Of late, China has emerged as the major steel producer contributing to almost half of world steel output in 2009.
When the US became a net importer of steel as far back as 1959, the strong steel companies (“Big Steel”) started to influence the government and successfully lobbied for the introduction of protectionist measures4. It is estimated that these measures cost US consumers around USD 46 to 76 billion between 1970 and 2000. Currently, the industry has the highest number of protectionist measures. Steel-related AD measures accounted for 48% of all AD measures in 2007, up from 37% in 1999.
The costs incurred by the US steel consumers during 2000-07 were estimated at about USD 16.8 billion. This figure indicates how much influence the Big Steel has had in the US. Analysis further revealed that these measures were meant to save a dying industry in the US rather than countering unfair trade, which was the reason often advanced by the US when restricting steel imports. Protectionism, in fact became the ‘life blood’ of this industry. There was a general trend towards replacing tariff measures with non-tariff measures in the steel industry as indicated in Exhibit 5.
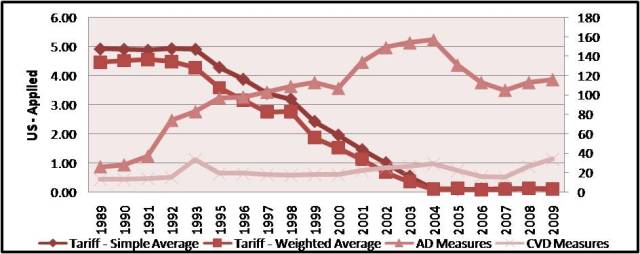 Exhibit 5 US Steel: Tariffs vs. Non Tariff Measures (Source: UNCTAD Trains, Temporary Trade Barrier Database Analysis, World Bank)
Automotive Sector
Similar to the steel sector, the automotive sector has also been witness to a shift in manufacturing away from countries such as the US to China. Due to substantial overcapacity, the non – Organization for Economic Co-operation and Development (OECD) countries benefited from a cost advantage given their low cost production facilities and labour.
The recent economic crisis has aggravated the problems faced by this industry in the developed countries5. Hence, following the crisis, developed country governments responded with financial stimulus packages for producers and introduced vehicle scrapping schemes to spur the industry. The packages included funding for development of green technologies and innovation. The stimulus and vehicle scrapping schemes were to the tune of $17.4 billion in the US and € 6 billion in France. A close examination of these schemes indicated that while they may have been warranted to put the industry back on track, they were protectionist in that they subsidized local producers and gave preferential treatment to domestic over imported cars. As in the case of the steel sector, one could question whether these measures were introduced to counter unfair trade or whether they were a continuation of political economy driven measures to save a dying industry, as would appear from the size of stimulus packages mentioned above.
Conclusion
Countries have always used protectionist measures to safeguard their domestic industries; especially their declining industries and even today they continue to do so. However, the striking characteristic of today’s protectionist instruments is that they are far more complex and non-transparent than earlier measures such as tariffs and quotas. The recent economic crisis clearly indicates that during economic slowdowns, there is a rise in protectionism. But the main difference today is that this protectionism may be harder to identify and to remove as it is likely to be far more entrenched in the form of other domestic policies. With more and more countries participating in global trade, the rise of murky protectionism is a matter of concern.
Keywords
Protectionism, Trade Distortions, Tariffs, Non-Tariff Measures, Steel, Automotive
Contributors
Rupa Chanda is a Professor in the Economics & Social Sciences Area at IIM Bangalore. She has Bachelors in Economics from Harvard University and a PhD in Economics from Columbia University. She can be reached at rupa@iimb.ernet.in
Mohamed Afsal Majeed (PGP 2009-11) holds a B. Tech in Electronics and Communication Engineering from National Institute of Technology, Calicut. He can be reached at mohamed.majeed09@iimb.ernet.in
Emmanuel Joseph (PGP 2009-11) holds a B. Tech in Electronics and Communication Engineering from National Institute of Technology, Calicut. He can be reached at emmanuel.joseph09@iimb.ernet.in
References
1 “World Tariff Profiles 2009”, World Trade Organization and International Trade Centre UNCTAD/WTO 2009
2 Fredrik Erixon and Razeen Sally, “Trade, Globalisation and Emerging Protectionism since the Crisis”, ECIPE Working Paper. 02/2010
3 World Trade Organization, World Bank, UNCTAD, GTA, WITS and Market Access Databases
4 William H Barringer, Kenneth J Pierce and Matthew P McCullough, “Still paying the price – An Update to Paying the price for Big Steel”, American Institute of International Steel, November 2007
5 “Responding to the Economic Crisis - Fostering Industrial Restructuring and Renewal”, OECD Working Paper, July 2009
