Risk Return Analysis of Clean Development Mechanism (CDM) Small Hydro Power (SHP) Projects in India
Faculty Contributor : A. Damodaran, Professor
Student Contributors : Madhurjya Das and Tarun Kumar
Harnessing hydroelectricity is extremely important for India’s future and Small Hydro Power (SHP) projects are the way to go forward. However, what factors affect the risk and returns of such projects? Does the adoption of Clean Development Mechanism (CDM) make the projects more viable? This article uses the techniques of regression and simulation to examine these questions.
India has huge hydropower resources, only 23 percent of which has been harnessed so far 1. Increasing the use of hydroelectricity is among the top priorities of the Government of India, for whom, the target is to increase the contribution percentage of hydroelectricity in the total electricity consumption from the current share of 25% to that of 40% 2. SHP projects, in particular, have an estimated gross potential of more than 15000 Megawatt (MW) 3. In addition, they are more viable and feasible for India because of its high population density and an earthquake prone landscape. Many factors affect the performance of SHP projects and the exact dependence relationship is worth examining. Besides, the effect of adopting clean development mechanism (CDM) for these projects is a topic that is worth probing into, as CDM is the way for the future.
Clean Development Mechanism (CDM)
CDM, as envisaged in the Kyoto Protocol incentivises the Annex-I countries or the developed countries, to invest in emission reduction projects in non-Annex-I countries , which are mostly developing and low cost countries. The developed countries are also required to comply with mandatory emission reduction targets unlike the developing countries. CDM enables the achievement of a reduction in carbon dioxide (CO2) emissions at the lowest cost. It also promotes sustainable development in the host country. For each ton of CO2 emission reduction, project promoters of these projects receive one Certified Emission Reduction (CER) or carbon credit which can be traded in the international markets or can be bought and used by Annex-1 countries to meet their mandatory emission reduction targets. To get the CER, project promoters of these projects have to get their projects registered under UNFCCC.
SHP Projects under CDM in India
Micro and mini SHPs are of interest under CDM because, if developed correctly, they directly displace greenhouse gas emissions and contribute to sustainable rural development. In total, there are 46 hydro projects from India, which have applied for registration for CDM with UNFCCC. Majority of them are SHPs and in the range of 1MW to 10 MW. Besides, technology used in majority of these projects (33 out of 46) is run-of-the-river 4 , so for the purpose of this study, SHP projects only up to 10 MW with run-of-the-river technology have been considered. Out of these 33 run-of-the-river projects, only one was rejected by UNFCC 5. So the probability of getting CER for these projects is quite high (97%). We now look into the factors that affect the performance of SHP projects.
Methodology
The risk and return of SHP projects depends on several quantifiable and non-quantifiable variables. However, in our analysis, we use only certain variables among them to determine the risk and return of the SHP with satisfactory accuracy. We have used data from the project design documents 6 (PDD) of projects filed for CDM.
Variables like CDM cost, Operations and Maintenance (O&M) cost etc. do not bring any kind of uncertainty to the revenue and risk associated with any SHP. These are the certain variables. Uncertain variables like number of CER/MW, installation cost, Electricity Tariff rates, PLF & CER price not only increase the uncertainty but also introduce risks of making false future financial projections. @RISK software has been used to calculate the uncertainties and to find the relation between financial factors.
Assumptions
For analysis, we have taken the following assumptions:-
- All uncertain variables are random and normally distributed.
- The salvage value of the projects is zero.
- The usable age of each project is 25 years.
- We have used Straight line depreciation to depreciate installation cost over the full life of the plant.
- Electricity Tariff, CER price, Running Cost and verification fees increase by a rate of 2.5% per year. Therefore, even though Tariff and CER price are random, they have an upward trend.
- Cost of Capital of the projects is 16%.
- Registration cost is zero.
We have taken number of CER generated per year per MW of SHP as uncertain with an average of 3437/MW/Year. We have also taken the price of CER as uncertain with an average of INR 783. These two numbers are based on the CER generated by the projects already registered and the market price of CER for the past 6 months. The results of our analysis have been presented in the exhibits.
Analysis for Risk and Return
We calculated IRR, NPV, ROC etc for projects registered for CDM and not registered for CDM. We also calculated the standard deviation of these variables for both the cases to estimate the change in the risk with CDM registration.
Regression Analysis
We conducted a regression analysis (Ref: Exhibit 1) between the PLF of the run-of-the-river projects and the average rainfall in the region. Contrary to the popular belief that the PLF of the run-of-the-river projects is positively correlated with the average rainfall of the region, this study concluded that there is no evidence of any kind of correlation between the rainfall and the PLF of the hydel project. PLF depends on other important factors like the nature of the river, the location of the project and the technology used etc.
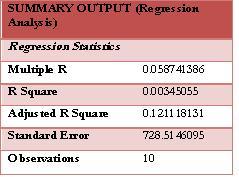 Exhibit 1 Regression analysis of PLF and Average Rainfall of the region
Analysis of ROC, NPV & IRR for smaller projects
Exhibits 2, 3 and 4 show the results of a comparison between SHPs with & without CDM consideration on the basis of return on capital (ROC) (Exhibit 2), net present value (NPV) (Exhibit 3) and internal rate of return (IRR) (Exhibit 4). Based on these results we concluded that the introduction of CDM for SHPs in the range of 1MW to 10MW actually makes projects more viable and feasible. For the very small projects (1-2MW), the probability of negative NPV and very low ROC/IRR is very high, in the range of 40-50%. It is this risk, which makes these SHP projects financially unviable. Even though CDM is not making much of a difference in NPV, IRR or ROC for these very small projects, its introduction drastically reduces the chances of negative NPV or very low IRR or ROC. (Ref: Exhibit 5) This is because of the fact that the probability of registration under CDM is very high (97%), which creates a small alternate and additional revenue source that plays a significant role in making these SHPs financially viable. This can be viewed in the terms of risk diversification. Going with CDM introduces an alternate source of revenue and hence diversifies the risk and decreases the uncertainty.
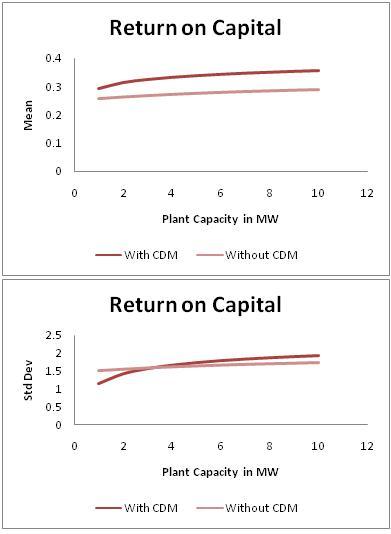 Exhibit 2 Plot of Mean and Standard Deviation of ROCs of projects against Capacity
Analysis of ROC, NPV & IRR for larger projects
For projects in the range of 3MW to 10MW, the revenue stream from CER played a significant role in value creation for the developer. As CDM registration is normally for 21 years, revenue from selling the CER, generated every year, create a definite revenue stream for SHPs. In this range (3MW to 10MW), revenue stream from CER created a difference of 5-6% (Exhibits 2, 3 and 4) in ROC and IRR and increased the NPV drastically. The increase in the NPV is so prominent because of the fact that initial cost of CDM registration remains constant while income though CER increases significantly. The cost of registration, validation etc remained constant around close to INR 700,000.
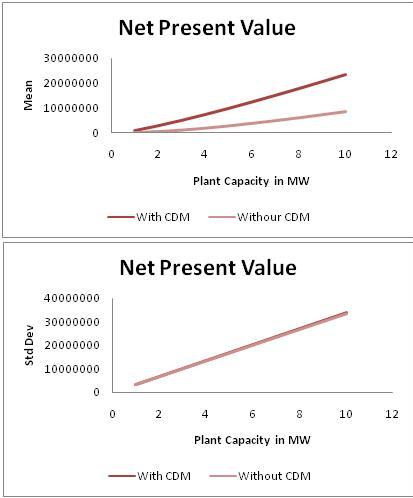 Exhibit 3 Plot of Mean and Standard Deviation of NPVs of projects against Capacity
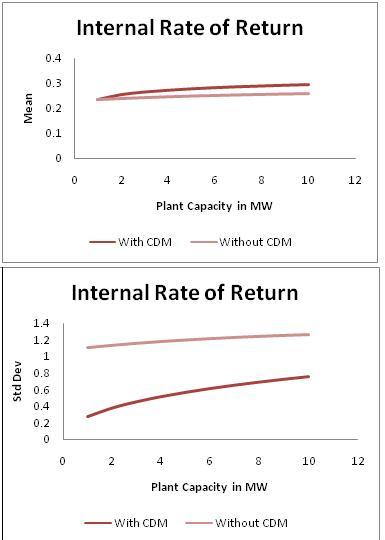 Exhibit 4 Plot of Mean and Standard Deviation of IRRs of projects against Capacity
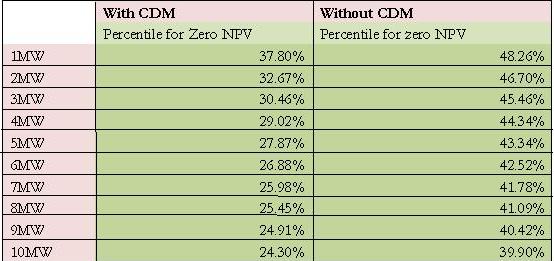 Exhibit 5 Probability of zero NPV for with and without CDM project
Conclusion
In this way, we can conclude that for very small projects in the range of 1-2MW, CDM acts as a cushion against value destruction while it acts as significant revenue source for bigger projects in the range of 3-10MW. Further, addition of CDM does not increase risk and uncertainty; instead it brings certainty and makes projects economically feasible.
Keywords
Hydropower, Indian power sector, SHP, CDM, Risk Return Analysis
Authors
A Damodaran is a Professor in the Public Policy area at IIM Bangalore and is also the Chairperson of the Post-graduate Program in Public Policy and Management. He holds a Ph D in Economics from University of Kerala, India. He can be reached at damodaran@iimb.ernet.in
Madhurjya Das (PGP 2008-10) holds a B.Tech from Indian Institute of Technology, Guwahati and can be reached at madhurjya.das08@iimb.ernet.in
Tarun Kumar (PGP 2008-10) holds a B.Tech from Indian Institute of Technology, Kharaghpur and can be reached at tarun.kumar08@iimb.ernet.in
References
- Purohit, Pallav,2008, International Institute for Applied Systems Analysis (IIASA), Schlossplatz 1, A-2361 Laxenburg, Austria, “Small hydro power projects under clean development mechanism in India: A preliminary assessment”, science direct journal, volume 36, issue 6 June 2008, pages 2000-2015
- Ibid.
- http://mnes.nic.in/prog-smallhydro.htm. Last accessed on February 09, 2010
- http://www.cdmindia.nic.in/cdmindia/projectList.jsp, http://cdm.unfccc.int/index.html. Last accessed on February 09, 2010
- Ibid.
- Ibid.
