The Indian Volatility Index - An effective hedging instrument?
Faculty Contributor: Sankarshan Basu, Associate Professor
Student Contributors: Arup Halder, Chandra Prakash Tiwari
This article focuses on explaining the merits and demerits of the volatility index (VIX). While measuring the implied volatility in the market, the VIX is also a great tool for hedging in times of financial distress. It also helps traders in cases of expected volatility in the market. The primary focus here is the Indian stock market and the benefits of VIX to stakeholders in the Indian markets.
The Volatility Index (VIX) measures the implied volatility in the market using the price levels of the index options. The attractiveness of VIX stems from the fact that it is negatively correlated with the underlying index, and that it creates a new asset class which bases itself on non directional volatility views. In the Indian context, the introduction of VIX has helped the traders gauge market sentiments and many traders are already using VIX values for their trading calls.
What is VIX?
The Volatility Index (VIX) is a key measure of market expectations of near-term volatility conveyed by stock index option prices. Since its introduction in 1993 by CBOE, VIX has been considered by many to be the world's premier barometer of investor sentiment. It has become the benchmark for stock market volatility. The VIX index is also known as fear and greed index in the market. VIX is based on real-time option prices, which reflect investors' consensus view of future expected stock market volatility. During periods of financial stress, which are often accompanied by steep market declines, option prices - and VIX - tend to rise. Greater the fear, higher is the VIX level. As investor fear subsides, option prices tend to decline, which in turn causes VIX to decline.
The need for such an asset class which derives itself more on the movement and not on the direction has been made particularly important in light of the high volatility in the markets, coupled with the increasing frequency of financial crises.
The Indian Context
The volatility index will increase the understanding among people. Once that happens, we will be ready to launch products based on it.
C.B Bhave, Chairman of SEBI
In India, VIX was launched in April, 2008 by National stock exchange (NSE). The VIX index of India is based on the Nifty 50 Index Option prices. The methodology of calculating the VIX index is same as that for CBOE VIX index. The current focus on the VIX is due to its inherent property of negative correlation with the underlying price index, and its usefulness for predicting the direction of the price index.
VIX as a Hedging Instrument
The most notable feature of the VIX is its negative correlation with the price index. This presents immense potential to use the volatility asset class as offered by the VIX as an effective hedging instrument. The correlation of Indian VIX with the NIFTY index is shown in the following table for various periods. The negative correlation of VIX with NIFTY as seen from the table makes it an excellent hedging tool.
|
Duration |
Correlation |
|
1 week |
-0.68 |
|
1 month |
-0.74 |
|
2 months |
-0.76 |
|
3 months |
-0.88 |
|
6 months |
-0.32 |
Exhibit 1:
Correlation between NIFTY and VIX index for various durations
The correlation is very high in short term (1 week to 3 months), however in long term the negative correlation goes down as the VIX is a range bound index while the stock index may go significantly up or down in long term. The following graph depicts the inverse movement relation between the VIX and the underlying price index.
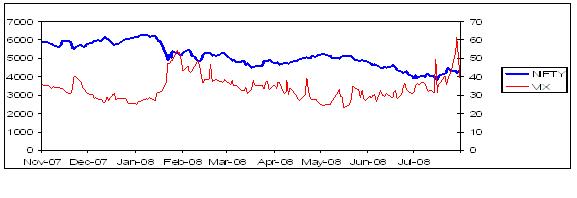 Exhibit 2
NIFTY and VIX movement from November, 2007 to July, 2008
Exhibit 2
NIFTY and VIX movement from November, 2007 to July, 2008
Index & VIX Returns
The return of VIX index was observed on the days when the NIFTY index gave negative returns. The analysis was done for the days with less than -1%, -2%, -3% and -4% returns. The period chosen for the analysis of the data was November 1, 2007 to July 31, 2008. It was observed that the number of days on which NIFTY gave less than -1% return is 59 and the average return on these days is -2.64%. Out of these 59 days, the VIX index gave positive returns on 50 days. The average return on VIX index for these 59 days (when the NIFTY index was up 1%) was 3.75%. This shows that VIX offsets the negative returns of the underlying index.
A similar exercise was carried out for the days on which NIFTY gave returns of -2%, -3% and -4% respectively. It can be seen that as the average return on NIFTY decreases, the return on VIX index increases. The negative NIFTY returns and corresponding VIX returns are shown in Exhibit 3.
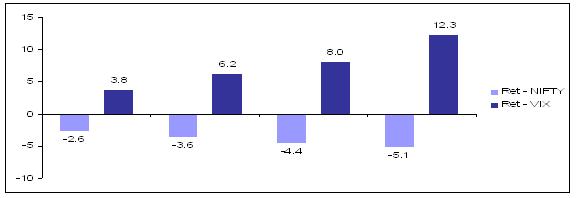 Exhibit 3
Average Daily Returns of NIFTY and VIX index for negative NIFTY returns
Exhibit 3
Average Daily Returns of NIFTY and VIX index for negative NIFTY returns
The result for the positive NIFTY returns is shown in Exhibit 4. It can be seen that the VIX is a good hedge when the returns are not very high on a particular day. However, if the NIFTY returns are very high on a particular day, VIX has also given positive return or only slightly negative return.
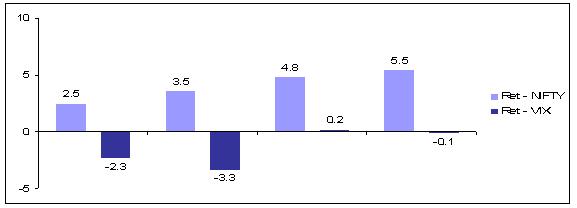 Exhibit 4
Average Daily Returns of NIFTY and VIX index for positive NIFTY returns
Exhibit 4
Average Daily Returns of NIFTY and VIX index for positive NIFTY returns
Thus we observe that the VIX is a very good albeit biased hedging instrument. On most of the days, correlation of the returns is negative, however, when the markets move up significantly, VIX may show positive correlation with the market. In a way, this hedge is better than the other market neutral hedging schemes as VIX will limit the downside but wouldn�t offset the gains if the markets move up significantly.
VIX is a very good albeit biased hedging instrument. On most of the days, correlation of the returns is negative, however, when the markets move up significantly, VIX may show positive correlation with the market.
Volatility Trading
VIX options are an excellent tool for traders who want to take a position on expected implied volatility. Just like traditional stock options, they can be traded during normal stock market hours through a securities broker. The features of volatility trading are that they are non directional in nature, and that the view taken by a trader is that of whether the underlying asset will be more volatile in the future or not. The traditional way to implement such a view without incurring directional risks would be to use non-vanilla options like straddles, strangles or through variance swaps. However, with the introduction of VIX derivatives, such views can be simply implemented, with the advantage of having a standardized implied volatility calculation. Furthermore, such index based VIX derivatives, would enable implementation of complex strategies like volatility arbitrage. However, in India, the trading on VIX is not allowed as of now and the VIX is used just to gauge to volatility in the market.
Shortcomings of the Indian VIX
One of the major shortcomings is the illiquid option markets that are present in India. This is typically seen in the form of very low volumes for far month options, as well as a high bid ask spread. Also, the VIX calculation assumes that the option prices are continuous. In US the difference between the consecutive options strike is 25 while in India it is 50, which is contrary to the continuous strike price assumption. Such factors lead to a calculated VIX value which may be biased due to illiquidity, low volumes and non continuous strike prices. This bias may be removed by using a modified calculation of the Indian VIX using volume and bid ask spread filters.
Another shortcoming that we observed was the lack of transparency in the NSE manual regarding the VIX calculation. The NSE VIX methodology mentions MIBOR as the risk free rate, however it does not mention the term duration of the MIBOR rate that needs to be used.
Conclusion
Modeling of market volatility is one of the most important issues of recent times. Accurate modeling and forecast of volatility are of immense importance in managing the risk. The current sub-prime crisis has further emphasized the importance of accurate modeling and forecasting of volatility.
In the Indian context, the introduction of VIX has helped the traders gauge market sentiments and many traders are already using VIX values for the trading calls. The introduction of trading in VIX index will enable active management of risks that cannot be hedged. The regulator will allow the trading in index as well when the market participants will become comfortable with the index. We believe that the developed instruments like VIX will significantly contribute to the development of the emerging markets like India in the course of time.
Authors
Prof. Sankarshan Basu is an Associate Professor in the Finance and Control Area at IIM Bangalore. He holds a Ph.D. in Statistics from London School of Economics and Political Science and M.Sc. in Statistics from Indian Institute of Technology (IIT) Kanpur. He can be reached at sankarshanb@iimb.ernet.in
Arup Halder (PGP 2007-09) holds a B. Tech. in Electrical Engineering from the Indian Institute of Technology (IIT) Madras. He can be reached at aruph07@iimb.ernet.in
Chandra Prakash Tiwari (PGP 2007-09) holds a B. Tech. in Electrical Engineering from the Indian Institute of Technology (IIT) Kanpur. He can be reached at chandrap07@iimb.ernet.in
Keywords
Financial Services, Stock markets, Stock Index, NIFTY, VIX
References
- 'VIX: CBOE Volatility Index', Chicago Board Options Exchange, 18 September, 2003, http://www.cboe.com/micro/vix/vixwhite.pdf , Last accessed on 17 February, 2009.
- 'National Stock Exchange of India', http://www.nseindia.com , Last accessed on 14 October, 2009.
- Slepaczuk, Robert and Zakrzewski, 'Emerging versus developed volatility indexes: The comparison of VIW20 and VIX Index', 3 March, 2008, Social Science Research Network.
