Predicting Stock Market Crashes
Faculty Contributor: Jayadev M., Associate Professor
Student Contributors: Sathish M., Subash R.
Bull or bear, time and again sentiments have proved to be an uncontrollable force in taming them down. No matter how strong the fundamentals are, strong negative sentiments can pull down a strong bull market. Stock market crashes and sharp corrections are no longer a rare phenomenon. Indian markets dipped 50% in the months from January to September 2008. When sentiments are so critical, can technical indicators predict stock market crashes? This article presents two models based on technical analysis fundamentals which could serve as predictors of stock market crashes in India. Tested on market data of the last 8 years, the models yielded an accuracy of 80%.
A stock market crash is a sudden drastic decline of stock prices across a significant cross-section of the market. Crashes are often driven by panic amongst the investors. At such times, external economic events combine with crowd behavior and psychology in a loop where selling by some market participants drives more market participants to sell. A predetermination of market crash can help investors save their money that is at stake due to investments in the stock market. It can even help one earn during the crashes by hinting beforehand, the right time to buy options such as put that give the holder the right to sell at a predetermined high price.
Given the attractiveness of the problem, there have been numerous attempts at modeling a reliable crash predictor. However, a universally accepted solution is yet to be established. The varying psyche of investors across markets makes it difficult to formulate a common crash predictor. Among the existing approaches, technical analysis deals with charts, trends, formulas and other calculations that are all based on the past and present highs and lows of the market. Building upon some known elements of technical analysis, this article describes two models which may prove to be the answer to the prediction problem. The models have been tested upon the crashes in Indian markets over an eight year period beginning 2000.
The Platform: Technical Analysis1
The price of a security represents a consensus at which an investor is willing to buy and another is willing to sell primarily depending on expectations from the stock. Because human beings are involved (and hence their behavior) much of the world's investment decision is based on criteria such as income levels, employment scenario, risk taking ability etc.
Essentially, technical analysis examines two areas of investing: the analysis of market "psyche" (or sentiment), and the analysis of supply-demand.
Technical analysis is the process of analyzing a security's historical prices in an effort to determine probable future prices. This is done by comparing current price action (i.e., current expectations) with comparable historical price action to predict a reasonable outcome. It considers only the actual price behavior of the market or instrument, on the assumption that price reflects all relevant factors before an investor becomes aware of them through other channels. Essentially, technical analysis examines two areas of investing: the analysis of market "psyche" (or sentiment), and the analysis of supply-demand.
Technical analysis is widely used among traders and financial professionals such as technical analysts, who seek to identify price patterns and trends in financial markets. To exploit these patterns, the analysts use various methods and tools, indicators being one of them. These technical indicators are typically mathematical transformations of price or volume. They are used to help determine whether an asset is trending, and if it is, its price direction.
Establishing the link
Sentiments are mirrored in the prices of the stock. As panic sets in, the stock prices go down and this gets reflected in the technical indicators too. As technical indicators go into sell mode, this further brings down the sentiments leading to a further drop in prices. This vicious cycle continues leading to a crash. As stock prices start their downward journey, technical indicators begin to change their directions and generate negative signals. These signals are pointers of rough patches ahead. A trader can make use of these indicators, mitigate his losses and even profit by going short.
The Building Blocks
The first step in developing a prediction model is to correctly identify the target and predictor variables that explain the phenomenon.
Definition of a crash
Definition of a stock market crash is ambiguous and highly subjective. There are numerous definitions available but no numerically specific one. According to FT Alphaville2, a free daily financial news and commentary service from Financial Times, the term commonly applies to a double-digit percentage fall in the stock markets over five minutes. After a careful study of the Indian markets over the last eight year period, a stock market crash in Indian context is established as a "fall in the NIFTY of more than 10% within a span of 20 days" or "difference of more than 10% between the high on a day and the low on the next trading day" or "decline in the NIFTY of more than 9% within a span of 5 days". As per the given definitions, Nifty observed as many as 15 crashes during the period 2000 to 2008 with the latest ones having occurred in the months of January, May and June of 2008.
Selection of Indicators3
In early 2000, the Indian markets were heating up and the bull phase was about to set in. Markets experienced a bull run during the period 2003-2007. Towards the fag end of 2007, bears set in and 2008 saw a bearish phase. The indicators that were chosen and the reasons for choosing them are shown in Exhibit 1. Few of these indicators are leading, a few others lagging and a couple of them are good reflectors of the sentiment and the momentum prevailing in the markets. The indicators were chosen with the aim of making the models as comprehensive as possible so that the models work under different market conditions.
| S.No |
Indicator 4, 5 |
Reason |
| 1 |
DMA (Displaced Moving Average) |
Good trend following and widely used technical indicator |
| 2 |
TRIX (Triple Exponential Moving Average) |
Leading indicator, works well in trending periods and serves as a momentum indicator too |
| 3 |
MACD (Moving Average Convergence/Divergence) |
Momentum and trend following indicator |
| 4 |
Stochastic Oscillator |
Leading indicator and momentum indicator - Good short term indicator |
| 5 |
A/D (Advance - Decline) ratio |
Commonly used to reflect sentiments prevailing |
| 6 |
Put - Call ratio |
Good sentiment indicator |
| 7 |
McClellan Oscillator |
Good short term market breadth indicator |
| 8 |
FII Cash Flows |
Liquidity indicator and FII have been ruling the roost for the last few years in India |
Exhibit 1.Indicators chosen
The Prediction Models
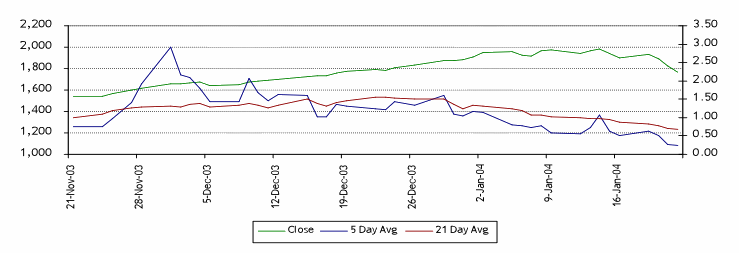
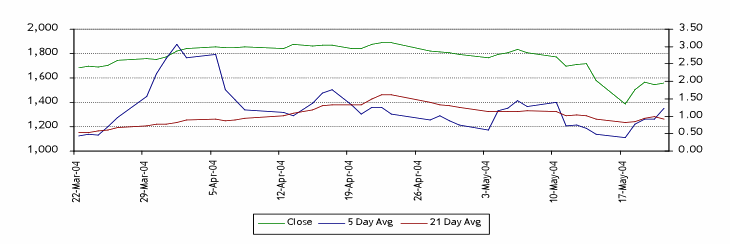
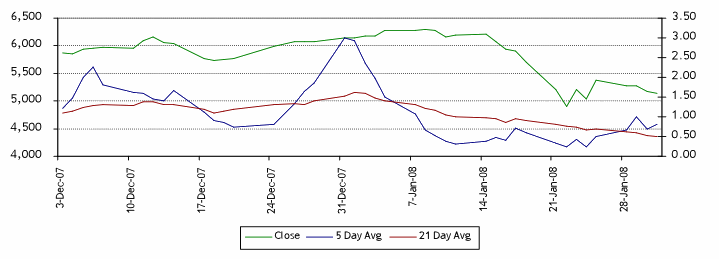
The behaviour of the above indicators before the identified crash periods was analysed thoroughly. On a stand alone basis, no trend or pattern was observed in the behaviour of few of these indicators before the crash period. However, a pattern was observed with respect to behaviour of Advance/Decline (A/D ratio) ratio, a good sentiment indicator. For example, during three crash periods as shown in the following exhibits, 21 day Average A/D ratio fell steeply from 1.5 to 0.9 before the crash and 5 day Average A/D ratio hovered around 0.5. In periods prior to the remaining crashes, a fall in A/D ratio was observed, but the intensity of the fall varied, thus predicting the fall became difficult.
 Exhibit 2. Average A/D ratios over the period 21 Nov'03 to 16 Jan'04
During Dec'03-Jan'04, 21 Day Average A/D ratio fell from 1.5 to around 0.99 and 5 day Average showed some very small values of the range 0.55 - 0.6 on 9th Jan and 12th Jan. Nifty fell by around 12% in 3-4 days starting from 13th Jan'04
 Exhibit 3.
Average A/D ratios over the period 22 Mar'04 to 17 May'04
During the phase of Apr'04-May'04, 21 Day Average A/D ratio fell from 1.5 to around 0.9 and 5 day Average showed some very small values of the range 0.6-0.7 on 2nd May and 3rd May. Nifty fell by around 25% in 6-7 days starting from 6th May'04
 Exhibit 4.
Average A/D ratios over the period 21 Jul'06 to 15 Sep'04
During the phase of Aug'06-Sep'06, 21 Day Average fell from 1.5 to around 0.9. 5 day Average showed stable values. Nifty remained stable.
 Exhibit 5.
Average A/D ratios over the period 3 Dec'07 to 28 Jan'08
During the phase of Dec'08-Jan'08, 21 Day Average from 1.5 to around 0.99 and 5 day Average showed some very small values of the range 0.3 - 0.5 on 9th Jan - 12th Jan. Nifty fell by around 20% in 3-4 days starting from 14th Jan'08.
Development of Models
Combinations of the selected indicators were chosen to prepare models for predictions. Two of these models were found to be very effective in prediction.
Model 1
The behaviour of the technical indicators (identified earlier) prior to the crashes was carefully studied. The indicators generated bearish signals before the crash period. However, not all indicators generated bearish signal before the crashes. Surprisingly, a few generated bullish signals. Numerous combinations of these indicators were tested and the following combination of four indicators generated bearish/sell signals 14 times and crashes were observed in 10 such instances. The first signal is generated when stock market closing price falls below 50 day DMA and remains there for 2 consecutive days. McClellan oscillator going into sell mode generates the second signal. When the slope of 10 day DMA and 12 day DMA becomes negative, the third signal is generated and the fourth signal is generated when market closing price is less than previous day's closing price. The results are tabulated in Exhibit 6
| Number of days before the crash |
Period(s) |
Result |
| 0 |
Jul'00, May'06 |
Crash |
| 1 |
Jan'08 |
Crash |
| 2 |
Sep'07, Aug'08 |
Crash |
| 3 |
Apr'00, Feb'01, Oct'05, Feb'07 |
Crash |
| 4 |
May'04 |
Crash |
| 5 |
Jun'01 |
Correction |
| 10 |
Mar'05 |
Correction |
| - |
Dec'00, Mar'02 |
No crash |
Exhibit 6.
Signals Generated by Model 1
The above model generated 14 signals in the past eight years. In 10 of those instances, NIFTY crashed. The model was back tested on the crashes of May and June 2008. The model predicted the crashes a couple of days before they occurred. These studies reveal that this model has a reasonable accuracy of 80% in predicting the crashes. The crash of September 2001 (exceptional event) was undetected by this model.
Model 2
The study revealed that another set of indicators collectively was able to predict stock market crash with reasonable amount of accuracy. The first indicator is movement of Nifty close below its 10 day DMA. It was reconfirmed by MACD and TRIX and Stochastic oscillator. A movement of negative 1.4% on a day; final signal generates the third signal. This model generated signals 13 times in the past eight years prompting to sell in all instances except for Apr'00, where the Stochastic oscillator and 10 day DMA had prompted to buy. In 10 of these instances, NIFTY crashed. A false signal was also generated once. The model was back tested on the crashes of May and June 2008. This model, like the earlier one was also able to predict these crashes. The accuracy of this model is also 80%.
Conclusion
The analysis of the behavior of the indicators resulted in development of two models of reasonable accuracy. The models developed can be of help to the trading community in predicting the crashes in future. However strong a technical indicator may be, it may not be of great help during a crash period until it is used in conjunction with other indicators. These models can serve as effective warning mechanisms which would require a thorough look at other data to validate their predictions.
Contributors
Jayadev M. is an Associate Professor in the Finance & Control Area at IIM Bangalore. He can be reached at jayadevm@iimb.ernet.in
Sathish M. (PGP 2007-09) holds a B.E in Electrical & Electronics Engineering from College of Engineering, Guindy. He can be reached at sathishm07@iimb.ernet.in
Subash R. (PGP 2007-09) holds a B.E in Mechanical Engineering from College of Engineering, Guindy. He can be reached at subashr07@iimb.ernet.in
Keywords
Finance & Control, Financial services, India, Trading, Equity, Nifty
References
- Steven B Achelis, 2000, Technical Analysis from A to Z , McGraw - Hill Publications.
- Sam Jones, 'FTSE 100 Crash', FT Alphaville, http://ftalphaville.ft.com/blog/2008/10/10/16897/ftse-crash/. Last accessed on December 9, 2008.
- John Murphy, 1999, 'The Technical Analysis of Financial Market', A comprehensive guide to trading methods and applications , Prentice Hall Press.
- Rick Bensignor, 2000, New Thinking in Technical Analysis: Trading Models from the Masters , Bloomberg Press.
- Thomas R Demark, 1994, The New Science of Technical Analysis , Wiley Publications.
